
Over 200 mph at Talladega, 128 mph at Bristol: the numbers explained
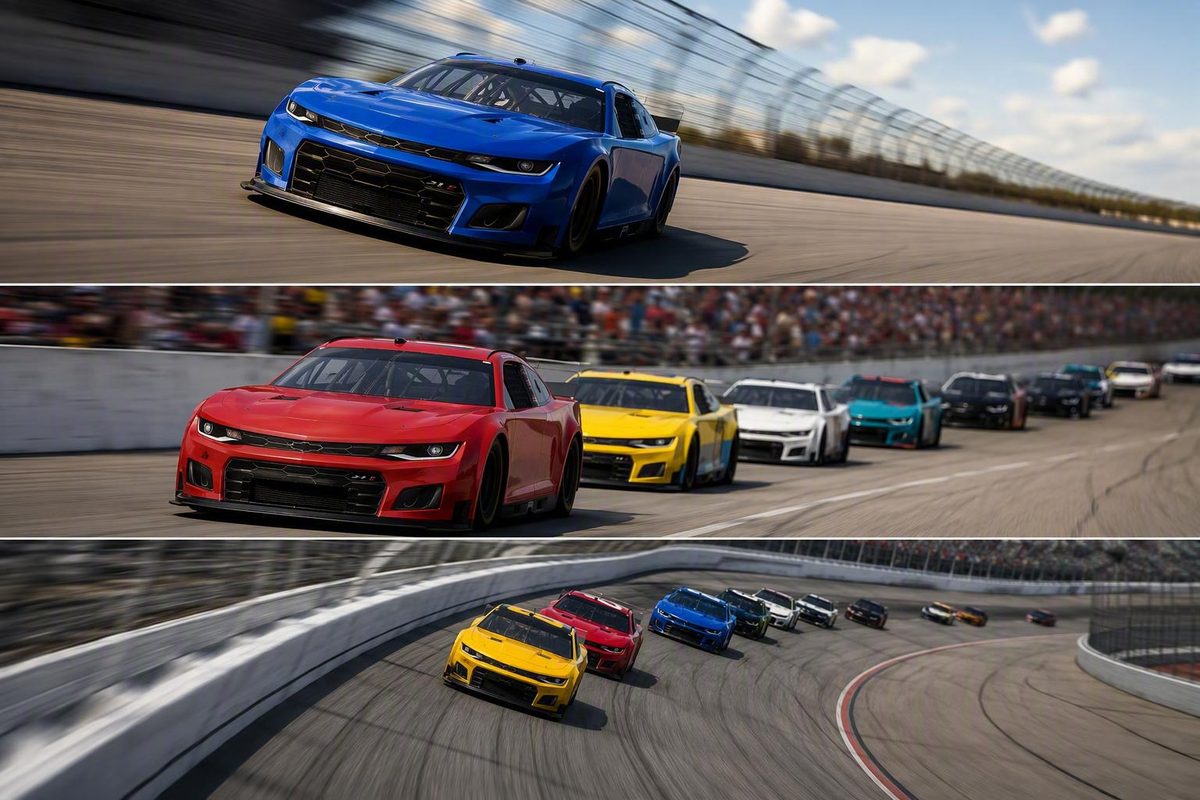
Cup car speed ranges from a reported 212.8 mph Talladega qualifying lap to 128 mph at Bristol and a 155 mph Daytona race average. Here is what each figure measures.
NASCAR Cup cars exceed 200 mph only on the two biggest superspeedways, Daytona and Talladega. Everywhere else the number falls fast: a calculated 190.40 mph qualifying-lap average at Atlanta, 128.00 mph at Bristol, and a generalized 80–120 mph range for short tracks. The most-quoted record, 212.809 mph, is a full-lap qualifying average attributed to Bill Elliott at Talladega in 1987, from a different car and rules era. The 2026 Daytona summer race averaged 155 mph from green flag to checkered, cautions included.
So the honest answer has three parts: which track, which year, and which measurement. A speed-trap peak, a qualifying-lap average, and a full-race average are three different numbers, and they can differ by 60 mph or more at the same circuit.
| Example | Year | Metric | Speed |
|---|---|---|---|
| Talladega, Bill Elliott | 1987 | Qualifying-lap average (secondary attribution) | 212.809 mph |
| Atlanta, Kevin Harvick | Not stated | Calculated qualifying-lap average | 190.40 mph |
| Bristol, Carl Edwards | Not stated | Calculated qualifying-lap average | 128.00 mph |
| Daytona, Cup race | 2026 | Full-race average, 166 laps | 155 mph |
The Talladega figure traces to a user-generated account attributing a 44.998-second qualifying lap to Elliott. The supplied evidence does not independently confirm its official-record status, so treat it as a historical attribution rather than a verified current benchmark.
The Atlanta and Bristol figures come from an independent technical analysis of calculated NASCAR lap speeds, which gives Harvick’s Atlanta lap as 29.118 seconds and Edwards’s Bristol lap as 14.99 seconds. The source does not state the year of either session; its 2017 publication date is not the session date.
The Daytona row is from NASCAR’s official results for the August 29, 2026 race, which list a 155 mph race average over 166 laps.
Lap Speed Is Track Length Divided by Lap Time
Every published NASCAR lap speed is a conversion, not a reading from a sensor. The series takes the official track length in miles, divides by the lap time in seconds, and multiplies by 3,600. A 30-second lap of an officially listed 1.5-mile oval is therefore 180 mph.
That car did not run 180 mph all the way round. It was faster than that at the end of each straight and slower through each corner; only the average lands at 180. The conversion also uses the official length, not the distance the car actually covered, and racing lines vary. Published lap speed is a standardized figure. Lap time is the cleaner comparison between two drivers at the same track; the speed is a useful translation of it.
Enter a track length and lap time, or tap a preset from the table above; the average speed updates beside the inputs.
NASCAR Lap Speed Calculator
Average speed in mph equals track length in miles × laps ÷ time in seconds × 3,600. Presets fill in the sourced laps from the article.
| Sourced lap | Time | Speed | Metric |
|---|---|---|---|
| Talladega, Elliott 1987 | 44.998 s | 212.809 mph | Qualifying-lap avg |
| Atlanta, Harvick | 29.118 s | 190.40 mph | Qualifying-lap avg |
| Bristol, Edwards | 14.99 s | 128.00 mph | Qualifying-lap avg |
| Daytona 2026 race | 2:40:58 | 155 mph | Full-race avg, 166 laps |
Sources: NASCAR official results (Aug 29 2026 Daytona), buildingspeed.org lap analysis (Atlanta, Bristol), user-generated attribution for Talladega 1987. Track lengths marked ~ are back-calculated from the source lap time and speed, not independently cited. Instantaneous top speeds are not shown; none is sourced.
The calculator reproduces the sourced figures from their lap times. Elliott’s 44.998 seconds returns 212.81 mph only if Talladega is entered at its implied 2.66 miles; Harvick’s 29.118 seconds gives 190.40 mph at 1.54 miles; Edwards’s 14.99 seconds gives 128.00 mph at 0.533 miles. Those lengths are back-calculated from the sources, not independently cited here.
Three Speeds That Get Mixed Up
Instantaneous speed is velocity at one moment, usually quoted at the end of a straight. It is the largest of the three numbers and the one people usually mean by “top speed”. A speed-trap reading or telemetry trace is the only way to see it; none of the four sourced figures above is one.
Qualifying-lap or fastest-lap average is the whole lap, straights and corners combined, computed as described above. This is what the 212.809, 190.40 and 128.00 mph figures are.
Full-race average is total race distance divided by total elapsed time, so it absorbs every caution lap and pit stop. This is what the 155 mph Daytona figure is, and it is why a race average is always well below the fastest lap of the same weekend.
Why Bristol at 15 Seconds Is Slower Than Atlanta at 29
The Atlanta–Bristol pair shows how much layout matters. Edwards’s Bristol lap took roughly half as long as Harvick’s Atlanta lap, yet it was 62 mph slower on average, because Bristol’s lap is far shorter. Tight short tracks force hard braking for every corner and leave little straight in which to rebuild speed. Daytona and Talladega combine long full-throttle runs with steep banking, so cars carry more speed through the turns and the lap average climbs past 200 mph.
For short tracks in general, one broad third-party overview puts typical averages around 80–120 mph. That is a generalized range, not an official NASCAR benchmark, and it is consistent with the calculated 128.00 mph Bristol qualifying lap sitting just above it. The draft evidence contains no sourced figure for road courses or dirt tracks; the same length-over-time arithmetic applies, but no number is given here.
What Cautions Do to the Daytona Race Average
The August 29, 2026 Daytona Cup race ran 166 laps in 2 hours, 40 minutes and 58 seconds with four cautions covering 23 laps, per the official NASCAR results. Entering 166 laps of Daytona’s implied 2.5 miles over 9,658 seconds into the calculator returns about 154.7 mph, which NASCAR reports as 155.
Roughly one lap in seven was run under yellow. Add pit-road time and restarts, and the gap between a green-flag lap and the race average is explained without any car being slow. A race average measures the event, not the machine.
Teams do not gear for the highest theoretical straight-line speed either. They gear and set up for lap time: acceleration off the corners, handling balance, tire life and, at Daytona and Talladega, behaviour inside a draft. Drafting cuts drag for a following car, which is why pack speeds and single-car speeds diverge at superspeedways.
The 2026 Daytona Rules Package Cut Spoiler and Horsepower
NASCAR can move speeds through both aerodynamics and permitted engine output. For the August 2026 Daytona race it reduced the rear spoiler from 7 inches to 4 inches and lowered horsepower from 510 to 465, per its announcement of the revised Daytona package.
Officials forecast beforehand that the lower-drag configuration would make single-car runs about 3 mph faster while pack speeds stayed roughly the same. That was a pre-race expectation. The supplied evidence does not include measured session data showing whether solo cars actually gained 3 mph or whether passing improved, and the 155 mph race average cannot answer that question because it includes caution laps.
A smaller spoiler means less drag and less downforce; fewer horsepower means less acceleration against that drag. Both change how a car behaves alone and in traffic without necessarily producing a new outright speed record.
Which Records and Outliers to Trust
The 212.809 mph Talladega figure is a reported full-lap qualifying average, not a speed-trap reading. Even if the 44.998-second lap is accepted, it belongs to a 1987 car under 1987 rules. It says nothing about what a Next Gen Cup car does today, and the sourcing here is secondary.
Claims of 220 mph and above should be treated with the same care. Stories about unrestricted tests reaching 228–240 mph circulate without primary timing documentation, and the available evidence does not establish them.
The 271.8 mph figure reported by the same third-party overview describes a straight-line salt-flat run, not a lap of any NASCAR circuit. Without documentation of the vehicle, driver, timing method and conditions, it stays a qualified report, and it has no bearing on race-trim speed at Daytona or Talladega.
The usable answer: Cup cars exceed 200 mph on the two superspeedways, run 190 mph-class qualifying laps at fast intermediates like Atlanta, and average under 130 mph on the fastest lap at Bristol. Before comparing any two NASCAR speeds, check that both are the same kind of number: a peak, a lap average, or a race average.